
CEOs and CFOs are often frustrated with spending a large percent of sales on marketing and sales expenses and not being able to know their impact. As important, CMOs need more definitive marketing budget metrics to justify requests for marketing budgets. In this blog we will examine the marketing budget performance impact for five well-known companies plus examine this performance longitudinally over ten-year period for Nike.
A company’s marketing budget typically includes both marketing and sales expenses. These are direct and indirect costs that a company incurs while promoting and selling its products or services. This includes advertising costs, marketing and sales staff salaries, commissions, travel expenses, and other promotional costs (1). While the average marketing budget as a percentage of revenue was 9.1% in 2023, 10% is often used as a rule of thumb (2).
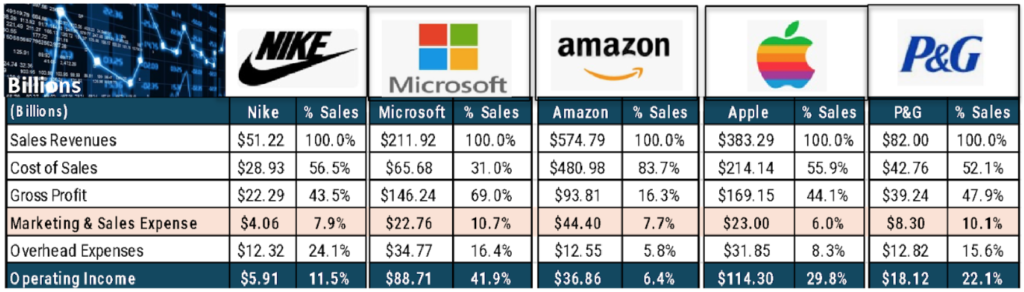
Figure 1 presents the 2023 income statements for five well-known companies. In standardized income statements the marketing & sales expenses are presented as a part of operating expenses (3). We obtained the marketing & sales expenses for these five companies (4) so operating expenses could be presented separately as marketing & sales expenses and overhead expenses.
FIGURE 1
Income Statements
MARKETING BUDGET PERFORMANCE METRICS
We will examine these five companies with respect to three marketing budget performance metrics. Each performance metric provides a different but important insight into how the marketing budget impacts…expenses, sales, and profits. We will also examine these marketing budget metrics over time for Nike to provide a managerial interpretation of their marketing budget performance impact.
Marketing Budget – Expense Impact
The marketing budget for the five companies in Figure 1 is important as it is a very large expense. The metric for this marketing budget expense is percent of sales. While the dollars spent on marketing and sales for the five companies in Figure 1 varies considerably from $4.06 billion (Nike) to $44.4 billion (Amazon), the marketing budget as a percent of sales allows for meaningful comparisons. This percent varies from 6% of sales for Apple to 10.7% for Microsoft.
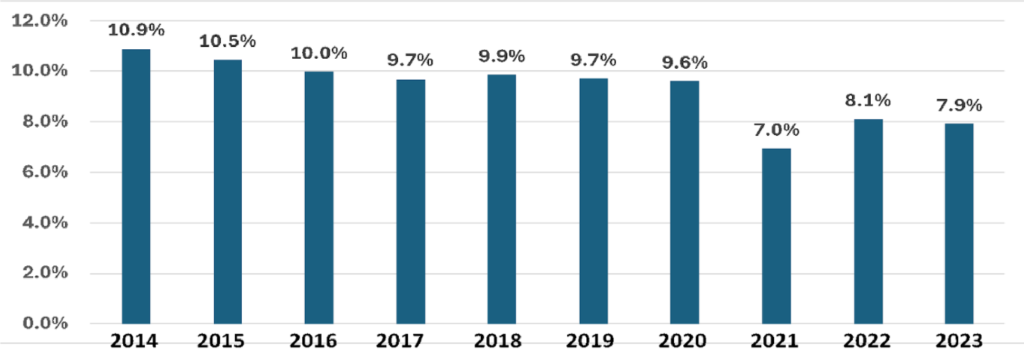
While insightful, a company would be more interested in its marketing budget as a percent of sales over time as well as how it compares to benchmark competitors. For example, Nike defines their marketing & sales expenses as Demand Creation Expenses (5) since the strategic intent of these expenses is to create demand for Nike products. In Figure 2 this expense as percent of sales of 10.9% in 2014 decreased to 7.9% in 2023. This shows that Nike steadily reduced the percent of sales for demand creation expenses over the past ten years. This would reduce overall operating expenses and allow more money to flow into profits.
FIGURE 2
Nike Demand Creation Expense (% sales)
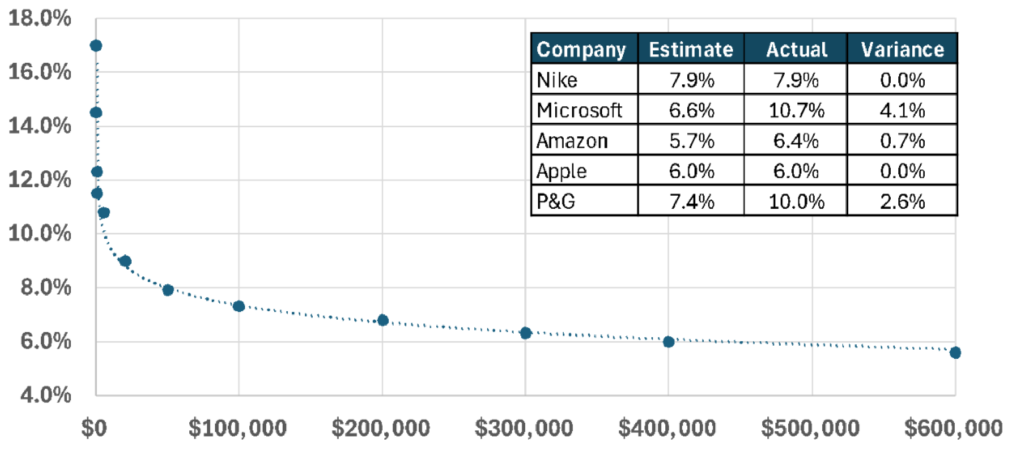
As a rule, the marketing budget as a percent of sales decreases with sales (2). Companies with sales under $1 billion have been shown to have marketing budget with a higher percent of sales as shown in Figure 3. This data shows companies with sales under $1 spend upward of 17% sales on their marketing budgets. This drops logarithmically at a much slower rate to under 6% of sales at $600 billion in sales.
Also shown in Figure 3 is the estimated marketing & sales expense percent of sales versus actual for the five companies we are benchmarking. Two are exactly as what would be predicted with one company slightly higher than estimated and two companies higher that estimated. These variances can be due to differences in industry dynamics which are not considered in the estimated average.
FIGURE 3
Marketing Budgets (% of sales) vs. Sales (millions)
Marketing Budget – Sales Impact
While the marketing budget as a percent of sales provides a benchmark for year-to-year management of this strategic expense, what does this level of expense produce in terms of sales? Figure 4 shows the sales productivity per $1 of marketing budget. Each company and the industry they compete in is different as these levels of marketing budget sale productivity varied from $9.3 (Microsoft) to $16.7 (Apple) with an average of $14.50 of sales per $1 of marketing budget.
FIGURE 4
Marketing Budget Sales Productivity
(Sales per $1 in Marketing Budget)
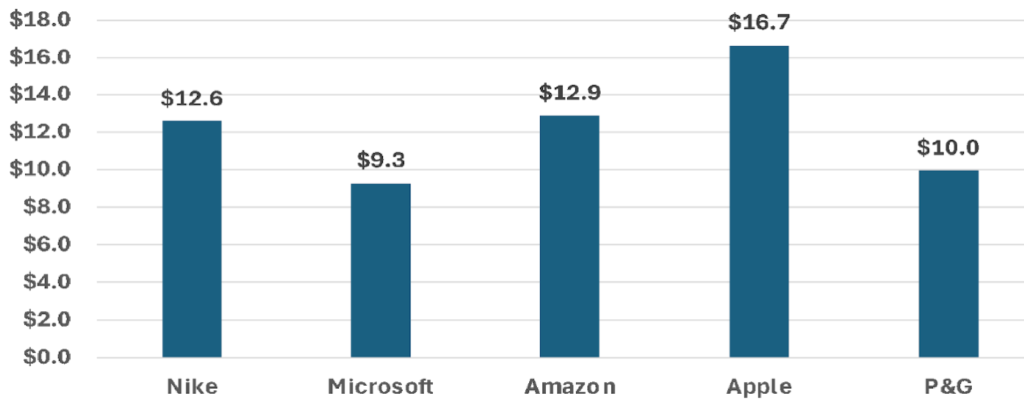
Average: $14.50 Sales per $1 Marketing & Sales Expenses
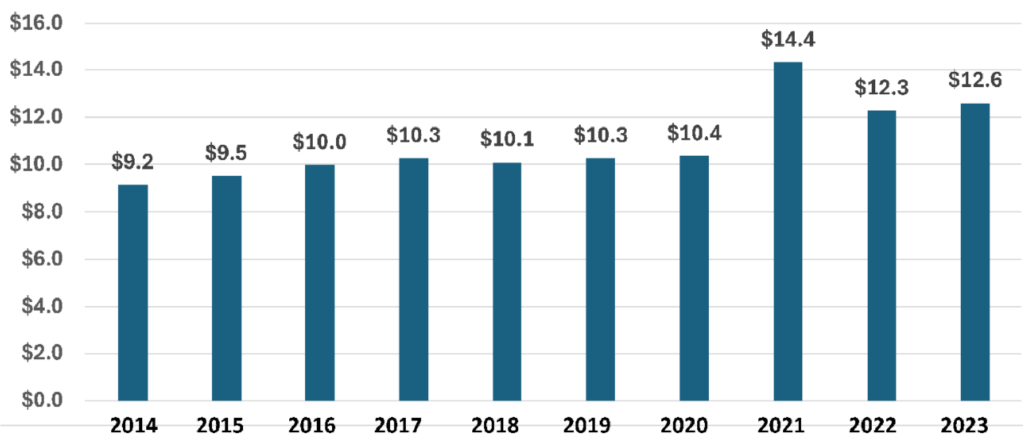
Over time this metric allows companies to track marketing budget sales productivity to see how it is changing year to year. For Nike their marketing budget sales productivity per $1 of marketing budget grew from $9.2billion (2014) to $12.6 billion (2023). During this period the Nike Demand Creation Expenses increased from $3 billion (10.9% of sales) in 2014 to $4.1 billion (7.9% of sales) in 2023. This shows that while Nike increased its marketing budget by $1 billion over 10 years it was able to do this at a lower percent of sales and achieve a higher level of marketing budget sales productivity over this 10-year period.
FIGURE 5
Nike Marketing Budget Sales Impact (2014-2023)
Marketing Budget – Profit Impact
The marketing budget’s contribution to overhead expenses and profits can be measured with Net Marketing Contribution (5).
Net Marketing Contribution (NMC) = Sales – Cost of Sales – Marketing & Sales Expense
NMC (Nike $billions) = $51.22 – $28.93 – $4.06 = $18.23
Operating Income (Nike $billions) = NMC – Overhead Expenses = $18.23 – $12.32 = $5.91
The Net Marketing Contribution for the five companies is shown in Figure 6. The NMC as a percentage of sales is the best way to compare the NMC of each company. As shown the Net Marketing Contribution (% sales) for these five companies ranged from 8.6% for Amazon) to 58.3% for Microsoft) with an average of 36% for all five companies.
FIGURE 6
Net Marketing Contribution
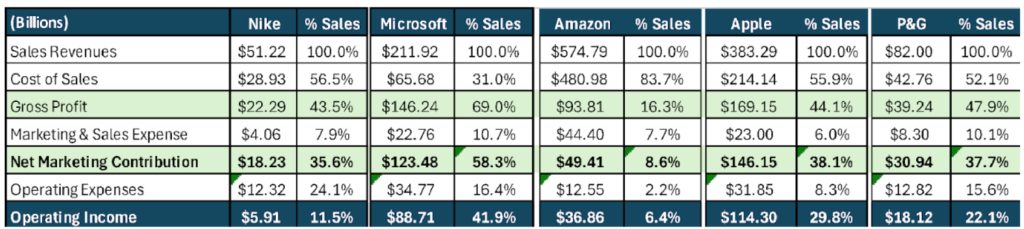
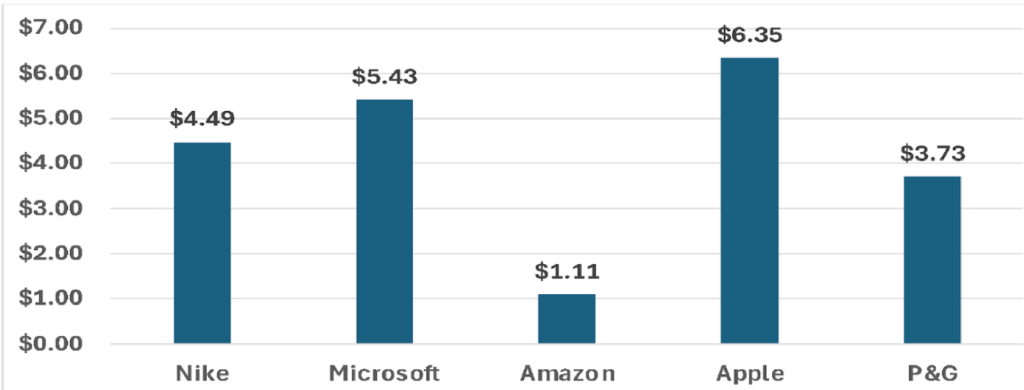
Figure 7 shows the profit impact of each dollar of marketing budget. This is the dollars in net marketing contribution per $1 of marketing budget. As shown, this marketing budget profit metrics varies from $1.11 per $1 of marketing budget for Amazon to $6.35 for Apple with an average of $4.24. The Apple CMO could argue for more marketing budget as at the margin each additional dollar of marketing budget would produce $6.35 of contribution to Apple overhead expenses and operating income.
FIGURE 7
Marketing Budget Profit Impact
Net Marketing Contribution per $1 Dollar of Marketing Budget
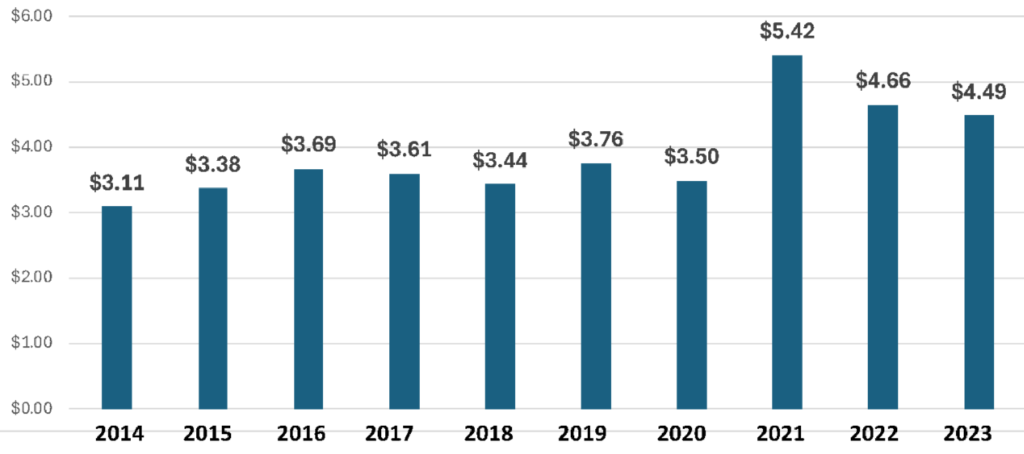
For Nike from 2014 t 2023 their net marketing contribution per $1 of marketing budget grew from $3.11 (2014) to $4.49 (2023). The year following the 2020 Covid year produced a discernable step up in NMC productivity. This is likely due to deferred purchases during the 2020 Covid year.
FIGURE 8
Nike Marketing Budget Profit impact 2014-2023)
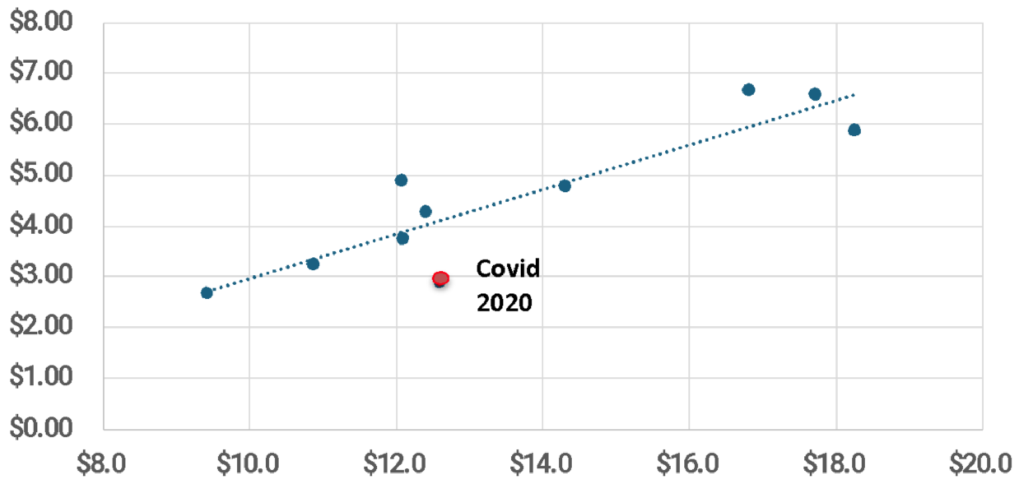
In 2023, Nike’s Net Marketing Contribution of $18.23 billion was the source of profits after marketing & sales expenses to pay for overhead expenses ($12.32 billion) and produce an operating income of $5.91 billion. Figure 9 illustrates the Nike relationship between NMC and Operating Income from 2014 to 2023 with a correlation of .81 (explained variance of 90%). The Covid Year (2020) is somewhat of an outlier. The correlation for years not including the Covid Year is is .87 (explained variance of 93%)
FIGURE 9
Nike Net Marketing Contribution vs. Operating Income (2014-2023)
CONCLUSION:
The data to create these three-marketing budget metrics are readily available. Using them enables CEOs and CFOs to assess the cost and impact of their investment in their company’s marketing budget. For CMOs these marketing budget metrics allow them to demonstrate what their marketing budget produced and support requests for additional marketing budget. For the financial services community this level of reporting would elevate the assessment of company performance.
References:
1. “What Are the Selling and Marketing Expenses of a Company?” https://quarterchart.com/financial-insight/selling-and-marketing-expenses
2. “What Percent of Revenue Do Companies Spend on Marketing and Sales?” [2024] [Breakdown by Industry] https://vitaldesign.com/percent-of-revenue-spent-on-marketing-sales/
3. 2023 Income Statements, Yahoo Finance
4. Company 2023 Marketing & Sales Expenses:
- Nike: 2023 10k Report
- Microsoft: Statista, https://www.statista.com/statistics/506534/microsoft-sales-marketing-expenditure/
- Amazon: Statista, https://www.statista.com/statistics/506535/amazon-marketing-spending/#:~:text=Worldwide%20Amazon%20marketing%20expenditure%202010%2D2023&text=In%20the%20fiscal%20year%202023,dollars%20in%20the%20previous%20year
- Apple: https://vitaldesign.com/percent-of-revenue-spent-on-marketing-sales/
- P&G: https://vitaldesign.com/percent-of-revenue-spent-on-marketing-sales/
5. Nike 10k Reports (2014-2023)
6. Market-Based Management (7th ed.), Chapter 6: Marketing Performance, Marketing Profitability & Growth, pages 137-143.