
The marketing and sales of expense are the basis of a marketing budget and includes these expenses:
Company & product advertising, sponsorships, social media, trade shows, retailer promotions, sales & service expenses as well as all people expenses (salary, overhead, travel, etc.) associated with marketing & sales activities.
Let’s first look at how companies traditionally account for their marketing budget in their financial reporting. Well, they don’t! Basically, marketing & sales expenses are included as part of Sales, General & Administrative Expenses (SG&A) as shown below for five sportswear companies.
FIGURE 1
Traditional Income Statements
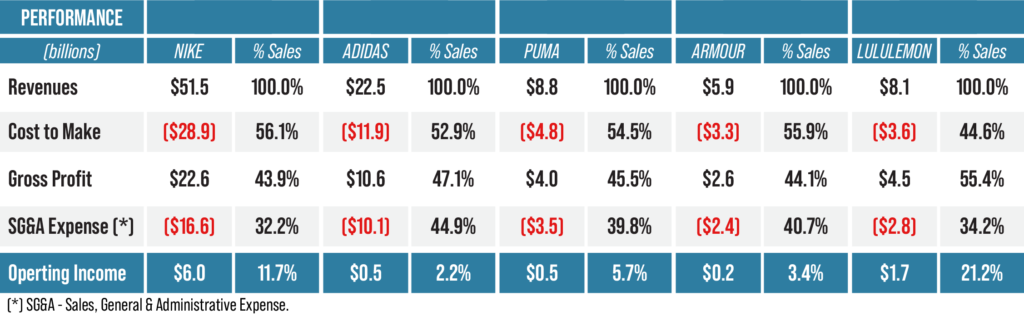
This reporting tells us a great deal about revenue, costs, margins, and operating income, but we have no insight in marketing and sales expenses which are essential to drive consumer demand and revenues.
Nike Demand Creation Expenses
The marketing budget (marketing & sales expenses) is built to create market demand for a company’s products and a 31.8% market share in 2023 (1). As shown in Figure 2 Nike Demand Creation Expenses play a key role in attaining their market share which in turn generate Nike revenues of $51.22 billion in 2023. Without consumer demand there are no revenues, and without revenues there are no profits. However, without transparency into marketing sales expenses, we cannot measure the profit impact of these expenses.
Nike provides an excellent example of transparency into their market budget labeled Demand Creation Expenses in Figure 2.Nike was clever to call their marketing & sales expenses Demand Creation Expenses since that is exactly what they are supposed to do – create demand for the company’ products that result in revenues. As shown in Figure 2 Nike unbundled SGA expenses of $16.61 billion into Demand Creation Expenses ($4.06 billion) and Operating Overhead
Expenses ($13.32 billion).
FIGURE 2
Nike 2023 Market Share & Income Statement (billions)
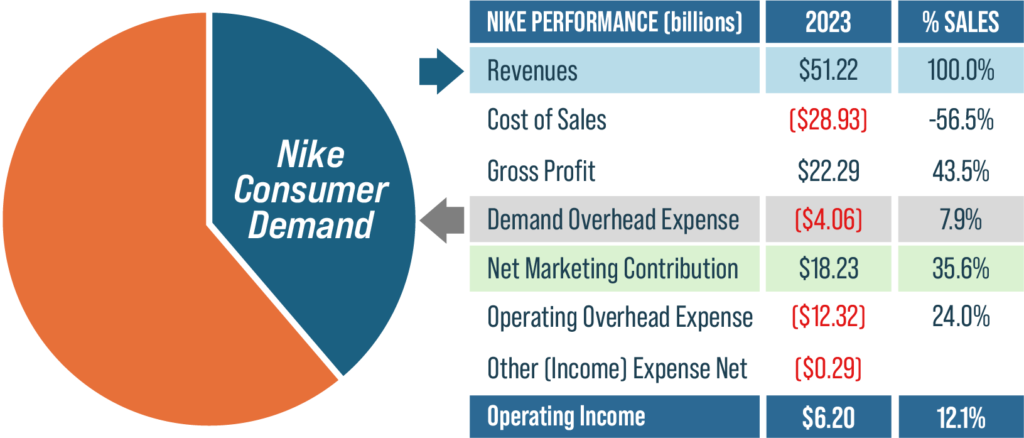
Nike Demand Creation Expense in 2023 were 7.9% of sales. This was 24.1% of SG&A expenses for Nike in Figure 1. Their Demand Creation Expenses in 2023 produced a Nike Market share of 38.8% and revenues of $51.22 billion. With a percent gross profit of 43.5% this resulted in $22.29 billion in gross profit.
Net Marketing Contribution
To measure the profit impact of a marketing budget we use Net Marketing Contribution (1). This is the contribution to profits after deducting the market budget expenses from gross profit as shown below and illustrated using the Nike example.
Net Marketing Contribution = Revenues x % Gross Profit – Demand Creation Expenses
Nike (NMC) = $51.22 billion x 43.5% – $4.06 billion = $18.23 billion
This Net Marketing Contribution of $18.23 billion is what the Nike created in profits with its Demand Creation Expenses. As shown below, the Net Marketing Contribution goes to pay for all operating overhead expenses and what is left is operating income. To summarize, the Nike Demand Creation Expenses ($4.06 billion) produced contribution of $18.23 billion to operating overhead and operating income.
Nike Operating Income = Net Marketing Contribution – Operating Overhead Expenses
= $18.23 billion – $12,32 billion = $6.20 billion (12.1% of sales)
As shown in Figure 2, in 2023 Nike’s NMC was 35.6% of sales. Deduct from the operating overhead expense as a percent of sales (24%) and we have an operating income that is 12.1% of sales.
Marketing Budget ROI
With Net Marketing Contribution (NMC) we can measure the profit impact of demand creation expenses (marketing & sales budget). We now have a way to measure the profit impact of a marketing budget. To summarize, the Nike Demand Creation Expenses ($4.06 billion) produced contribution of $18.23 billion to operating overhead and operating income. Dividing the NMC by the Marketing & Sales Budget creates a Marketing Budget ROI metric. Let’s look at this for our 2023 Nike example.
Marketing Budget ROI = Net Marketing Contribution/Demand Creation Expenses x 100%
= $18.32 billion/4.06 billion x 100% = 449%
This means that in 2023 each dollar of Demand Creation Expense produced $4.49 dollars in Net Marketing Contribution. Is this good or bad performance? One can only answer this question by looking at past performance, or better, the Marketing ROI of competitors or benchmark companies.
Benchmarking Marketing Performance Metrics
These marketing analytics allow a company such as Nike to benchmark past performance, major product lines (footwear, apparel, & equipment), regions (North America, Asia, Latin America) as well as benchmark companies that report their marketing & sales expenses (marketing budget) as part of their financial reporting. Shown below is Nike’s profit impact of their demand creation expenses and the company Marketing ROS and Marketing ROI for 2019
(Pre Covid 19), 2020 (Covid 19) and 2023.
FIGURE 3
Benchmarking Nike Marketing Budget ROI
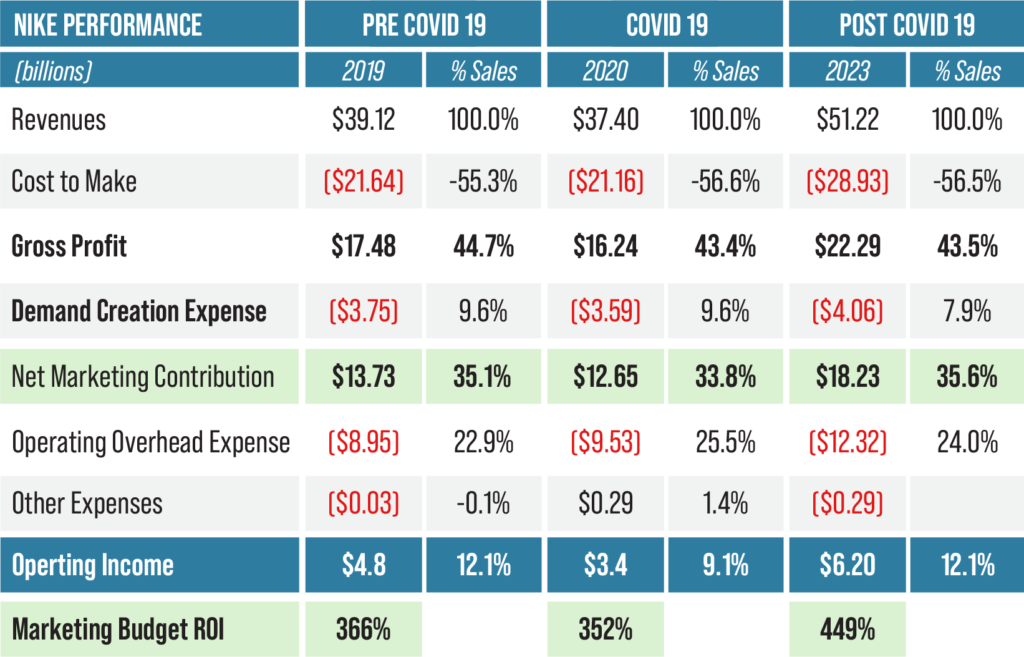
We can readily see that while during the 2020 COVID 19-year Nike had lower revenues and percent gross profits, Nike slightly improved its Marketing ROS and Marketing ROI over the Pre-COVID 19 year (2019).
More impressive is the revenue grow achieved by 2023 and improved marketing efficiency. While 2023 percent gross profit held at 43.5%, more effective spending on Demand Creation allowed Marketing ROI to drastically increase from 352% in 2019 to 449% in 2023. This is a tribute to Nike management, and particularly those in strategic and product marketing at Nike.
Ideally, we would benchmark competitors to gain even more insight on marketing budgets and their contribution to profits. However, no other sportwear companies report their Demand Creation expenses separate for their SGA expenses.
What Is Your Company’s Marketing Budget ROI?
The first step in understanding and measuring the profit impact of your marketing budget is to separate marketing & sales expenses from SGA expenses. From there, a company can track it’s marketing budget as a percent of sales, compute it’s net marketing contribution as a percent of sales, and measure a company’s Marketing Budget ROI as the ratio of Net Marketing Contribution to Marketing & Sales Expenses.
Learn more in Chapter 6 of Market-Based Management (7th edition). Chapter 1 can be reviewed online at www.mbm-book.com.
References:
- https://csimarket.com/stocks/competitionSEG2.php?code=NKE#google_vignette
- Net Marketing Contribution – Measuring Marketing Profitability, Market-Based Management (7th edition), Chapter 6, “Marketing Analytics, Performance & Profitability,” pages 136-140.
- Benchmarking Marketing Profitability, Market-Based Management (7 th edition), Chapter 6, “Marketing Analytics, Performance & Profitability,” pages 141-144